The Amazing Proportional Representation Simulator
What would Canada look like if we actually got the government we voted for?
What would our Parliament look like if a political party that got 45% of the votes got 45% of the seats, and a party that got 15% of the votes got 15% of the seats?
More and more Canadians are realizing that our voting system needs to change, but they want to know, "What will my riding look like? Will I still have an MP?"
Of course, no one really knows how any election will turn out, and we know that people will vote differently under a different voting system, but we can try to get an idea of how our political landscape would change under a proportional voting system by taking the actual results of previous elections, and reallocating the seats in our legislatures under different proportional voting models. |
 |
The Problem
The distortions inherent in our current First-Past-The-Post voting system lie in its winner-take-all nature. Because we elect only one member in each electoral district, or 'riding', as we call them in Canada, there are only a few winners, and lots of losers. Unfortunately, this applies not only to the candidates, but also to the voters who voted for them.
Under our current system, most of us vote for people who do not get elected, and so we end up with a government that most of us did not vote for.
The Solution
In order to have a Parliament that actually represents the people, we must have a voting system that accurately translates the will of the voters, as reflected in the votes they cast, into representation in our legislative assemblies.
This is called 'proportional' or 'full' representation.
The 75 countries in the world that use proportional voting systems have more accurate representation of their political parties, and they also have better representation of women, aboriginal people, and minorities of all sorts.
They also, according to the polls and studies, tend to have higher voter turnout, greater voter satisfaction with politics and politicians, better run economies, and better governance in general.
The Model
Voting systems create proportionality in two main ways, either by electing members from lists, or by electing more than one member from each riding.
Every system has strengths and weaknesses. Pure list systems give excellent proportionality, but no guarantee of geographic representation, which works well in Holland, but would not be right for Canada. Mixed systems create two types of MP, 'riding' MPs and 'list' MPs. Small multimember ridings give good geographic representation, but poor proportionality. In northern parts of Canada, our single-member ridings are already geographically huge, and multimember ridings would be larger still.
This is a model of a proportional voting system for the province of Ontario that attempts to get the best of all worlds by combining multimember urban ridings with single-member rural ridings. Since we will still have some single-member ridings, it will also be necessary to have compensatory provincial lists, but the partial proportionality gained through the use of multimember urban ridings will allow us to keep the provincial lists small.
In this model, I have increased the size of the Ontario Legislature by 21 MPPs, about 1/6 of the total seats in the province. These members will be elected from province-wide lists, and allocated to the political parties in such a way as to make the overall composition of the legislature as proportional as possible to the votes cast for each party in the election.
|  |
For purposes of illustration, the multimember ridings in this model have been created by simply combining the ridings that existed at the time of these elections. This is a simplistic approach, but it allows us to know what the vote totals are for the combined riding. In designing a real voting system, a full boundary reallocation would no doubt be done. The extra flexibility of having variable size ridings would probably allow for some rationalization of boundary lines to make them better conform to real urban communities.
Throughout this model, I have used the Webster/Ste. Lague method for allocating list seats to parties.
In this model, I have imposed no artificial threshold, because I can think of no good reason to do so.
These terms, plus the Index of Distortion are explained in more detail in the Glossary.
What would my riding look like?
To find out what your riding would look like under this model, find your riding on the lists below, and click on the link.
Note: In Ontario, provincial riding boundaries are set according to federal riding boundaries. The riding boundaries used in this simulation were in effect for the Canadian federal election of 2000 and the Ontario provincial election of 2003, and were supplanted by the boundary reallocation of 2004.
In this model, the following ridings would remain as single-member ridings:
The following ridings would be incorporated into multimember urban ridings:
What would Parliament look like?
Ontario provincial election - 2003
| Ontario - Actual results Ontario provincial election - 2003 |
| |
Liberal |
Progressive Conservative |
NDP |
Green |
Family Coalition |
Other |
Total |
| Votes received |
2,089,839 |
1,559,055 |
660,683 |
126,652 |
34,623 |
26,060 |
4,496,912 |
| Seats won |
72 |
24 |
7 |
0 |
0 |
0 |
103 |
| Seat % |
69.90% |
23.30% |
6.80% |
0% |
0% |
0% |
100% |
| Vote % |
46.47% |
34.67% |
14.69% |
2.82% |
0.77% |
0.58% |
100% |
| Distortion |
+23.43 |
-11.37 |
-7.89 |
-2.82 |
-0.77 |
-0.58 |
23.43 |
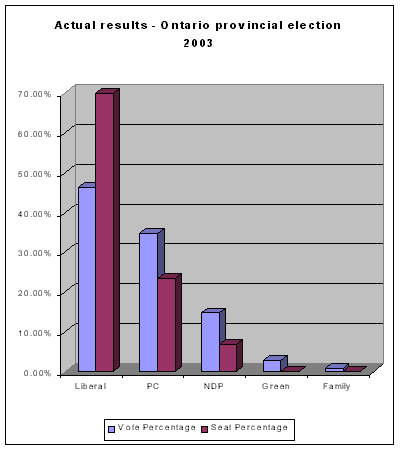
The 2003 Provincial election in Ontario generated a typical phony majority government, with the Liberals winning almost 70% of the seats, on the basis of having gotten less than 47% of the votes. The Progressive Conservatives, with almost 35% of the votes, had to settle for only about 23% of the seats in the Legislature. Many voters, from all parties, were startled to see the NDP drop to seven seats (6.8%), and lose their official party status, although they increased their vote percentage to almost 15%.
The Index of Distortion for these results is 23.43, an unacceptably high number. |
 |
Redistributing the seats according to our model, we get the following results:
| Ontario - Simulated proportional results - Ontario provincial election - 2003 |
| |
Liberal |
Progressive Conservative |
NDP |
Green |
Family Coalition |
Other |
Total |
| Seats won in multimember ridings |
31 |
23 |
13 |
0 |
0 |
0 |
67 |
| Seats won in single-member ridings |
22 |
11 |
3 |
0 |
0 |
0 |
36 |
| Total seats won in ridings |
53 |
34 |
16 |
0 |
0 |
0 |
103 |
| Compensatory seats won from lists |
6 |
8 |
2 |
4 |
1 |
0 |
21 |
|
| Total seats won |
59 |
42 |
18 |
4 |
1 |
0 |
124 |
| Votes received |
2,089,839 |
1,559,055 |
660,683 |
126,652 |
34,623 |
26,060 |
4,496,912 |
| Seat % |
47.58% |
33.87% |
14.52% |
3.23% |
0.81% |
0% |
100% |
| Vote% |
46.47% |
34.67% |
14.69% |
2.82% |
0.77% |
0.58% |
100% |
| Distortion |
+1.11 |
-0.80 |
-0.18 |
+0.41 |
+0.04 |
-0.58 |
1.55 |
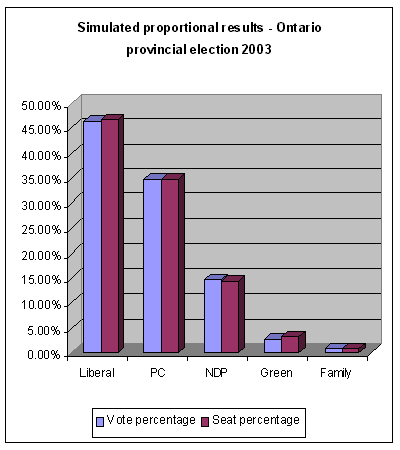
Now the distribution of seats to the parties matches the distribution of votes much more closely. There are a couple of noteworthy points:
The Index of Distortion has almost disappeared! The number is less than 2.0 for every party, and for the entire system.
Not only does the NDP no longer have any problem about its official status, but two new parties have also achieved representation in the Legislature, the Green Party and the Family Coalition Party, broadening the range of views represented.
Since no party got a majority of the votes, no party has a majority of the seats. Instead of a single-party monopoly government, this Legislature will generate a minority, or more likely, a coalition government, which will be able to remain in power only so long as it truly maintains the confidence of the house. |
 |
But perhaps this was too easy. What happens if we plug other election results into the model?
Canadian federal election 2000
| Ontario - Actual results Canadian federal election 2000 |
| |
Liberal |
Canadian Alliance |
Progressive Conservative |
NDP |
Green |
Other |
Total |
| Votes received |
2,292,075 |
1,051,209 |
642,438 |
368,709 |
39,737 |
58,437 |
4,452,605 |
| Seats won |
100 |
2 |
0 |
1 |
0 |
0 |
103 |
| Seat % |
97.09% |
1.94% |
0% |
0.97% |
0% |
0% |
100% |
| Vote % |
51.48% |
23.61% |
14.43% |
8.28% |
0.89% |
1.31% |
100% |
| Distortion |
+45.61 |
-21.67 |
-14.43 |
-7.31 |
-0.89 |
-1.31 |
45.61 |
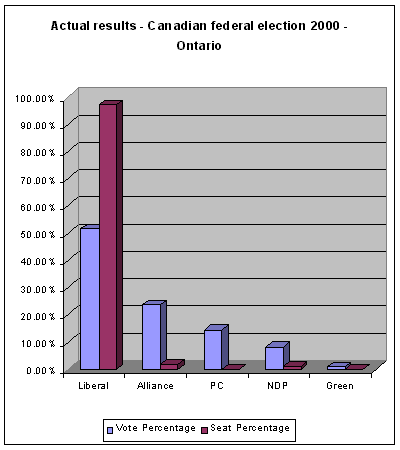
Perhaps the acid test for any voting model is the federal scene, where the First-Past-The-Post system vastly exaggerates our regional differences.
Our winner-take-all voting system has allowed the Liberals in recent elections to hold monopoly power in Canada by virtually sweeping Ontario.
These Ontario results from the 2000 Canadian federal election are pretty close to a 'worst case' scenario, in terms of distortion of the will of the voters.
As we see, the Liberals in 2000 won a preposterous 97% of the seats in Ontario, on the basis of less than 52% of the votes. The Canadian Alliance, with over a million votes, (more votes than they got in Alberta, and more votes than they got in British Columbia!), elected just two members (1.94%). The NDP got only one seat with over 8% of the votes. The Progressive Conservatives, with 642,438 votes, elected exactly nobody.
This is also a typical result under First-Past-The-Post, as we can see from recent provincial elections in B.C. and in P.E.I. |
 |
What happens when we plug these results into our model?
| Ontario - Simulated proportional results - Canadian federal election 2000 |
| |
Liberal |
Canadian Alliance |
Progressive Conservative |
NDP |
Green |
Other |
Total |
| Seats won in multimember ridings |
39 |
14 |
10 |
4 |
0 |
0 |
67 |
| Seats won in single-member ridings |
34 |
2 |
0 |
0 |
0 |
0 |
36 |
| Total seats won in ridings |
73 |
16 |
10 |
4 |
0 |
0 |
103 |
| Compensatory seats won from lists |
0 |
9 |
6 |
5 |
1 |
0 |
21 |
|
| Total seats won |
73 |
25 |
16 |
9 |
1 |
0 |
124 |
| Votes received |
2,292,075 |
1,051,209 |
642,438 |
368,709 |
39,737 |
58,437 |
4,452,605 |
| Seat % |
58.87% |
20.16% |
12.90% |
7.26% |
0.81% |
0% |
100% |
| Vote % |
51.48% |
23.61% |
14.43% |
8.28% |
0.89% |
1.31% |
100% |
| Distortion |
+7.39 |
-3.45 |
-1.53 |
-1.02 |
-0.09 |
-1.31 |
7.39 |
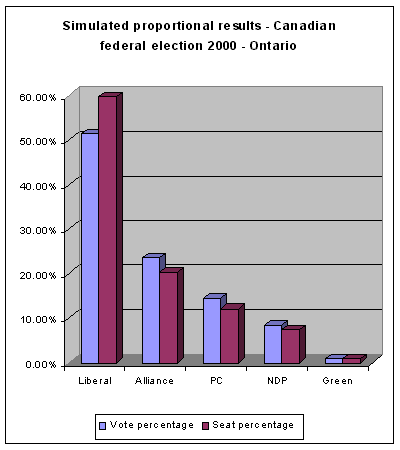
As we feared, the improvement is not quite so spectacular as in the provincial example. The Index of Distortion is still too high at 7.39, but it is certainly improved over the 45.61 in our actual results.
However, the Canadian Alliance has suddenly achieved an eastern breakthrough with 25 seats in Ontario, and the Progressive Conservatives and NDP are respectable again with 16 seats and 9 seats respectively in the province.
And we have a new voice in Parliament, with the Green Party electing a member from the provincial list.
All in all, the people of Ontario are much better represented in this model. |
 |
 |
What to do?
Only our elected representatives can change our voting system, but they all have a vested interest in the current system.
We will not get a fair voting system in Canada until the people demand it.
Fair Vote Canada is a nationwide citizen's movement to change the voting system in Canada.
Fair Vote Ontario is FVC's campaign to change the voting system in Ontario. |


