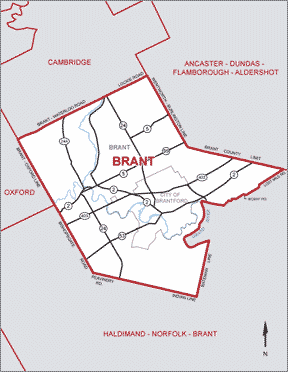
In this model, Brant would remain a single-member riding.
|
In this model, Brant would remain a single-member riding. |
|---|
| Brant - Actual results Ontario provincial election 2003 | |||||||
|---|---|---|---|---|---|---|---|
| Liberal | Progressive Conservative | NDP | Green | Family | Other | Total | |
| Votes received | 24,236 | 13,618 | 5,262 | 1,014 | 0 | 295 | 44,425 |
| Seats won | 1 | 0 | 0 | 0 | 0 | 0 | 1 |
| Seat % | 100% | 0% | 0% | 0% | 0% | 0% | 100% |
| Vote % | 54.55% | 30.65% | 11.84% | 2.28% | 0% | 0.66% | 100% |
| Distortion | +45.45 | -30.65 | -11.84 | -2.28 | 0 | -0.66 | 45.45 |
In the 2003 Ontario provincial election, the riding elected a Liberal MPP.
Under the existing voting system, 54.55% of the voters got the representative they voted for.
The other 45.45% of the votes were wasted.
In our model, we assume that the Liberal would still have won the riding.
Under this model, 54.55% of the voters in Brant would still have gotten the local representative they voted for.
However, another 44.77% of the voters would know that their vote had helped to elect provincial list members, so they too would have representation.
Only 0.66% of the votes cast would not have helped to elect an MPP, and therefore would have been wasted.
| Simulated compensatory list seats - Ontario provincial election 2003 | |||||
|---|---|---|---|---|---|
| Liberal | Progressive Conservative | NDP | Green | Family | Total |
| 6 | 8 | 2 | 4 | 1 | 21 |
| Brant - Actual results Canadian federal election 2000 | |||||||
|---|---|---|---|---|---|---|---|
| Liberal | Canadian Alliance | Progressive Conservative | NDP | Green | Other | Total | |
| Votes received | 24,068 | 10,955 | 3,580 | 3,126 | 484 | 447 | 42,660 |
| Seats won | 1 | 0 | 0 | 0 | 0 | 0 | 1 |
| Seat % | 100% | 0% | 0% | 0% | 0% | 0% | 100% |
| Vote % | 56.42% | 25.68% | 8.39% | 7.33% | 1.13% | 1.05% | 100% |
| Distortion | +43.58 | -25.68 | -8.39 | -7.33 | -1.13 | -1.05 | 43.58 |
In the 2000 Canadian federal election, the riding elected a Liberal MP.
Under the existing voting system, 56.42% of the voters got the representative they voted for.
The other 43.58% of the votes were wasted.
In our model, we assume that the Liberal would still have won the riding.
Under this model, 56.42% of the voters in Brant would still have gotten the local representative they voted for.
However, the another 42.53% of the voters would know that their vote had helped to elect provincial list members, so they too would have representation.
Only 1.05% of the votes cast would not have helped to elect an MP, and therefore would have been wasted.
| Simulated Ontario compensatory list seats - Canadian federal election 2000 | |||||
|---|---|---|---|---|---|
| Liberal | Canadian Alliance | Progressive Conservative | NDP | Green | Total |
| 0 | 9 | 6 | 5 | 1 | 21 |