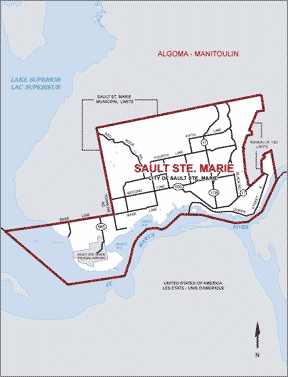
In this model, Sault Ste. Marie would remain a single-member riding.
 |
In this model, Sault Ste. Marie would remain a single-member riding. |
|---|
| Sault Ste. Marie - Actual results Ontario provincial election 2003 | |||||||
|---|---|---|---|---|---|---|---|
| Liberal | Progressive Conservative | NDP | Green | Family | Other | Total | |
| Votes received | 20,050 | 2,674 | 11,379 | 441 | 606 | 0 | 35,150 |
| Seats won | 1 | 0 | 0 | 0 | 0 | 0 | 1 |
| Seat % | 100% | 0% | 0% | 0% | 0% | 0% | 100% |
| Vote % | 57.04% | 7.61% | 32.37% | 1.25% | 1.72% | 0.00% | 100% |
| Distortion | +42.96 | -7.61 | -32.37 | -1.25 | -1.72 | 0 | 42.96 |
In the 2003 Ontario provincial election, the riding elected a Liberal MPP.
Under the existing voting system, 57.04% of the voters got the representative they voted for.
The other 42.96% of the votes were wasted.
In our model, we assume that the Liberal would still have won the riding.
Under this model, 57.04% of the voters in Sault Ste. Marie would still have gotten the local representative they voted for.
However, the other 42.96% of the voters would know that their vote had helped to elect provincial list members, so they too would have representation.
All of the votes cast would have helped to elect an MPP, and therefore none would have been wasted.
| Simulated compensatory list seats - Ontario provincial election 2003 | |||||
|---|---|---|---|---|---|
| Liberal | Progressive Conservative | NDP | Green | Family | Total |
| 6 | 8 | 2 | 4 | 1 | 21 |
| Sault Ste. Marie - Actual results Canadian federal election 2000 | |||||||
|---|---|---|---|---|---|---|---|
| Liberal | Canadian Alliance | Progressive Conservative | NDP | Green | Other | Total | |
| Votes received | 18,867 | 7,006 | 1,168 | 9,202 | 776 | 128 | 37,147 |
| Seats won | 1 | 0 | 0 | 0 | 0 | 0 | 1 |
| Seat % | 100% | 0% | 0% | 0% | 0% | 0% | 100% |
| Vote % | 50.79% | 18.86% | 3.14% | 24.77% | 2.09% | 0.34% | 100% |
| Distortion | +49.21 | -18.86 | -3.14 | -24.77 | -2.09 | -0.34 | 49.21 |
In the 2000 Canadian federal election, the riding elected a Liberal MP.
Under the existing voting system, 50.79% of the voters got the representative they voted for.
The other 49.21% of the votes were wasted.
In our model, we assume that the Liberal would still have won the riding.
Under this model, 50.79% of the voters in Sault Ste. Marie would still have gotten the local representative they voted for.
However, another 48.87% of the voters would know that their vote had helped to elect provincial list members, so they too would have representation.
Only 0.34% of the votes cast would not have helped to elect an MP, and therefore would have been wasted.
| Simulated Ontario compensatory list seats - Canadian federal election 2000 | |||||
|---|---|---|---|---|---|
| Liberal | Canadian Alliance | Progressive Conservative | NDP | Green | Total |
| 0 | 9 | 6 | 5 | 1 | 21 |